

Types of Charts in Trading & Technical Analysis
From Lines to Candles: Choosing the Lens of Your Edge
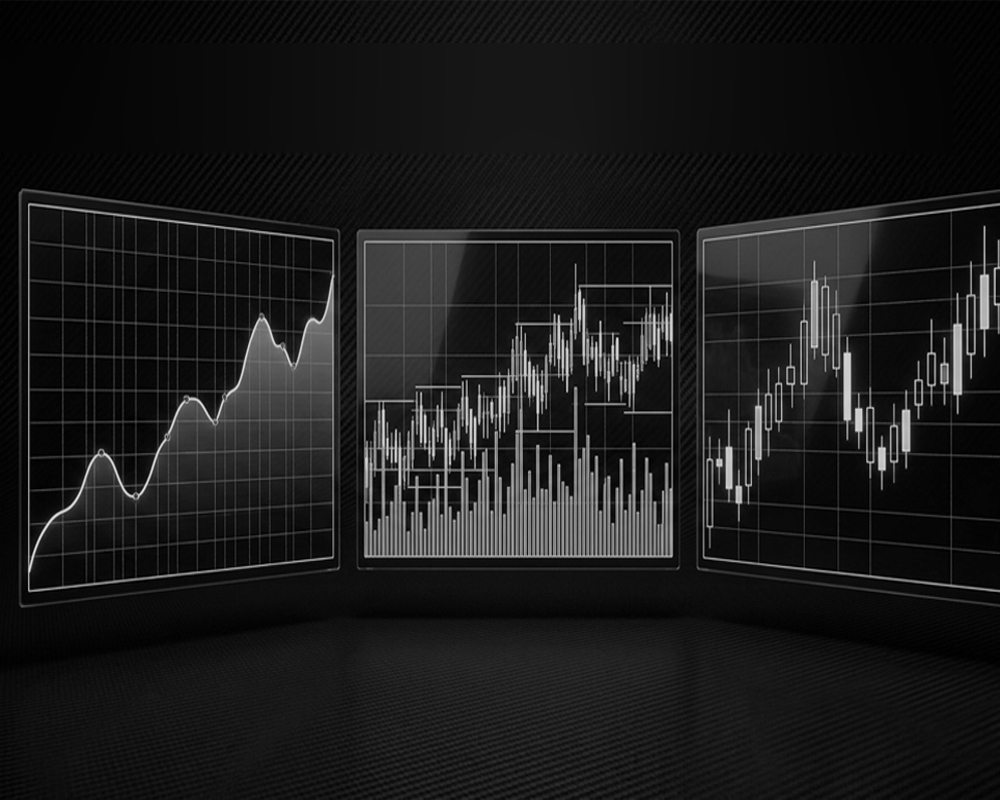
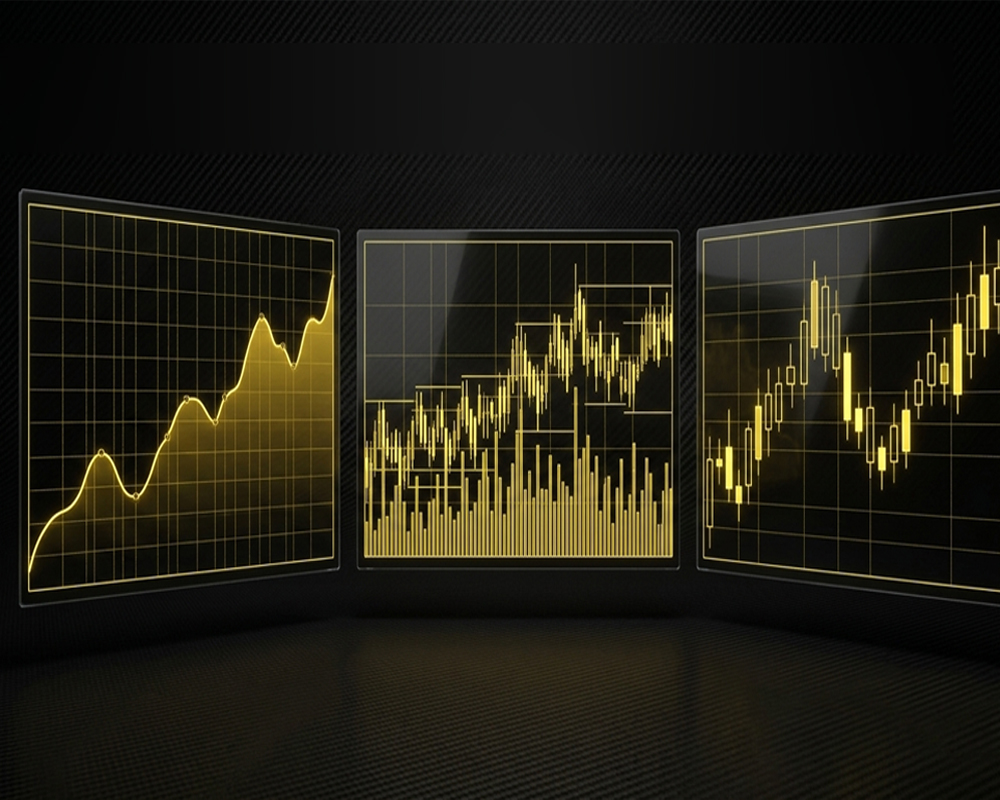
Trading charts visually represent price movements over time and are one of the foundations of technical analysis. The three most common types of charts in trading are line charts, bar (OHLC) charts, and candlestick charts. Each displays market data differently, helping traders analyze trends, price action, volatility, and market behavior. In this guide, we’ll compare these chart types, explain how each works, and help you understand when to use them.
The Visual Language of Price Action
Trading charts transform raw market data into a visual representation of price action. Instead of looking at a constantly changing list of prices, traders can use charts to understand how an asset has behaved over minutes, hours, days, months, or even years.
In technical analysis, charts help traders identify trends, momentum, volatility, support and resistance, and changes in market behavior. Whether you are analyzing Bitcoin, Ethereum, stocks, forex, or another financial market, the purpose is essentially the same: to organize historical price data in a way that makes market structure easier to understand.
However, not every trading chart presents information in the same way. A line chart emphasizes simplicity and overall direction, while an OHLC bar chart provides detailed information about each trading period. Candlestick charts display similar price information but make bullish and bearish behavior easier to recognize visually.
Understanding these differences is important because a chart should support your analysis, not dictate your decisions. Technical analysis deals with possibilities rather than guarantees. Traders should therefore learn to think in terms of probabilities rather than certainties when interpreting any trading chart.
The Three Main Types of Charts in Trading
Although trading platforms provide many different ways to visualize market data, three chart types form the foundation of traditional technical analysis: line charts, bar (OHLC) charts, and candlestick charts.
Each represents price differently and therefore serves a different analytical purpose. Understanding how these technical analysis chart types work allows traders to choose the most appropriate view for the information they want to study.
1. Line Chart: A Simple View of Market Direction
A line chart is one of the simplest types of charts used in trading. It normally connects the closing price of an asset from one period to the next, creating a continuous line that shows how price has changed over time.
For example, on a daily Bitcoin line chart, each point may represent Bitcoin's closing price for that day. Connecting those points creates a clear picture of the broader direction of the market.
Because line charts remove much of the information contained inside individual trading periods, they can make long-term trends and major price levels easier to recognize.
What Information Does a Line Chart Show?
A traditional line chart primarily displays time on the horizontal axis and price on the vertical axis. Closing prices are then connected by a continuous line.
Unlike candlestick and OHLC charts, a basic line chart usually does not show the open, high and low of every period. This makes the chart visually clean, but it also means that some information about intraperiod price movement is lost.
Advantages of Line Charts
The simplicity of a line chart can be useful when a trader wants to focus on the bigger picture rather than every short-term fluctuation.
- Identifying the overall market direction
- Recognizing longer-term trends
- Reducing visual noise
- Observing major price levels
- Comparing the performance of different assets
Line charts can also make broad support and resistance levels easier to identify because the chart contains fewer visual distractions.
Limitations of Line Charts
The simplicity of a line chart is also its main limitation. Because it generally focuses on closing prices, traders cannot easily see everything that happened inside each trading period.
For example, price may have moved sharply higher and lower during the day before eventually closing near its opening level. A simple line chart may hide much of that activity.
For traders who need detailed information about short-term price behavior, bar charts or candlestick charts are usually more informative.
2. Bar Chart (OHLC): A Detailed View of Price Movement
A bar chart, commonly called an OHLC chart, provides significantly more information than a basic line chart.
OHLC stands for Open, High, Low and Close. Each bar represents the price activity that occurred during a specific period.
If you are looking at a one-hour chart, for example, each bar represents one hour of market activity. On a daily chart, each bar represents one trading day.
How to Read an OHLC Bar
A standard OHLC bar contains four important pieces of price information:
- Open: The price at which the period began.
- High: The highest price reached during the period.
- Low: The lowest price reached during the period.
- Close: The final price when the period ended.
The vertical line represents the range between the high and low, while small horizontal marks indicate the opening and closing prices.
Together, these values give traders a much more detailed picture of what happened during a particular trading period.
Why Traders Use OHLC Charts
OHLC charts allow traders to study both market direction and the internal structure of individual trading periods.
They can help traders examine price ranges, volatility, opening and closing behavior, market structure, changes in buying and selling pressure, and reactions around important support and resistance zones.
Limitations of Bar Charts
OHLC charts contain plenty of useful information, but beginners may initially find them less intuitive than candlestick charts.
When hundreds of bars appear on the screen, quickly distinguishing bullish and bearish periods can require practice. This is one reason candlestick charts have become extremely popular among modern retail traders.
3. Candlestick Chart: Reading Price Action Visually
The candlestick chart is one of the most widely used chart types in modern technical analysis, particularly among cryptocurrency traders.
Like an OHLC bar, every candlestick normally contains four pieces of price information: open, high, low and close.
The main difference is how that information is displayed. Candlesticks use a rectangular body together with upper and lower wicks, making the relationship between opening and closing prices visually easy to understand.
Anatomy of a Candlestick
The body represents the distance between the opening and closing prices. The upper wick shows how high price travelled during the period, while the lower wick shows how low price moved.
When the closing price is above the opening price, the candle represents a bullish period. When the closing price is below the opening price, it represents a bearish period.
Colors vary between trading platforms and individual settings, so traders should understand the underlying price structure rather than relying only on candle color.
What Can Candlesticks Tell Traders?
Candlesticks make it easier to visually examine the interaction between buyers and sellers during a particular period.
- Strong buying or selling periods
- Price rejection
- Changes in volatility
- Market momentum
- Consolidation
- Potential reversals
- Breakouts
- Reactions around support and resistance
However, a single candlestick should rarely be interpreted in isolation. Its meaning depends heavily on market context, trend, nearby price levels, timeframe and the candles surrounding it.
Candlestick Patterns and Market Psychology
Certain combinations of candles are commonly described as candlestick patterns. Examples include the Doji, Hammer, Shooting Star, Engulfing patterns, Morning Star and Evening Star.
These formations can help traders describe price behavior, but they should not be treated as guaranteed predictions.
A hammer appearing randomly in the middle of a market may have little significance. The same structure appearing near an important support area after a prolonged decline may deserve considerably more attention.
This distinction is part of developing a broader trading philosophy instead of relying on isolated indicators or patterns.
Line Chart vs Bar Chart vs Candlestick Chart
The three major types of trading charts display market information differently. The following comparison makes their main differences easier to understand.
| Feature | Line Chart | Bar (OHLC) Chart | Candlestick Chart |
|---|---|---|---|
| Closing price | Yes | Yes | Yes |
| Opening price | Usually no | Yes | Yes |
| High & low | Usually no | Yes | Yes |
| Visual simplicity | High | Medium | Medium |
| Detailed price action | Limited | High | High |
| Beginner friendly | Very high | Moderate | High |
| Broad trend analysis | Excellent | Good | Good |
| Detailed technical analysis | Limited | Excellent | Excellent |
There is no universally “best” trading chart. The appropriate choice depends on the type of information a trader wants to analyze.
Which Type of Trading Chart Should You Use?
Choosing a chart type should depend on your objective rather than simply copying what other traders use.
Best Chart Type for Beginners
A line chart can be an excellent starting point because it makes trends and major price movements easy to understand without overwhelming the trader with information.
Once the basic relationship between price and time becomes familiar, moving to candlestick charts can provide considerably more detail.
Best Chart Type for Technical Analysis
Candlestick and OHLC charts generally provide more information for detailed technical analysis because traders can see the open, high, low and close of every period.
Candlesticks are particularly popular because this information can be interpreted visually and quickly.
Best Chart Type for Trend Analysis
Line charts can be useful when the primary goal is understanding the broader direction of a market. Removing intraperiod fluctuations can make major trends easier to see.
Best Chart Type for Price Action Trading
Candlestick charts are commonly preferred by price-action traders because candle bodies and wicks reveal information about how price behaved during each period.
However, chart selection alone does not create a trading edge. Sustainable trading also requires context, risk control, patience and discipline and risk management.
How Timeframes Change What a Trading Chart Shows
Chart type is only one part of technical analysis. Timeframe is equally important.
A candlestick on a 5-minute chart represents five minutes of market activity, while a candlestick on a daily chart represents an entire day.
This means the same asset can appear very different depending on the selected timeframe.
- Bitcoin may be rising on a 5-minute chart.
- It may be consolidating on a 1-hour chart.
- It may be falling on a daily chart.
- It may still be in a long-term uptrend on a weekly chart.
None of these observations necessarily contradict one another. They simply describe market behavior over different periods.
Traders should therefore understand both chart type and timeframe before drawing conclusions from price action.
Common Mistakes When Reading Trading Charts
Learning how to read a trading chart is relatively straightforward. Learning not to overinterpret the information is more difficult.
Treating Chart Patterns as Guarantees
A chart pattern represents historical price behavior, not a promise about what will happen next.
Financial markets operate under uncertainty, which is why traders should learn to think in terms of probabilities instead of certainties.
Ignoring Market Context
A candlestick pattern can have very different implications depending on where it appears. Trend direction, volatility, important price levels, volume, liquidity and the broader market environment can all affect interpretation.
Using Too Many Indicators
Adding more indicators does not automatically produce better analysis. Too many indicators can clutter a chart and sometimes provide conflicting information.
Every indicator or analytical tool added to a chart should have a clear purpose.
Ignoring Risk Management
Even an excellent technical setup can fail.
Charts help traders analyze markets; they do not eliminate risk. A trading approach therefore needs appropriate position sizing, predefined risk and consistent risk-management discipline.
Trading Charts Are Tools, Not Predictions
Line charts, bar charts and candlestick charts are different ways of viewing the same underlying market phenomenon: price changing through time.
A line chart simplifies that information to reveal broader direction. An OHLC chart provides detailed information about each trading period. A candlestick chart presents similar information in a highly visual format that makes price action easier to interpret.
The goal should not be to find a chart that predicts the future. Instead, traders can use charts to organize market information, develop scenarios, identify important price levels, manage risk and make decisions under uncertainty.
Understanding that distinction is central to developing a sustainable trading philosophy.
Frequently Asked Questions About Trading Chart Types
What are the main types of charts used in trading?
The three most common chart types in technical analysis are line charts, bar (OHLC) charts and candlestick charts. Line charts provide a simplified view of price direction, while bar and candlestick charts show the open, high, low and close for each trading period.
Which chart type is best for beginners?
Line charts are often the easiest for beginners to understand because they provide a clean view of price direction. However, learning candlestick charts is useful for traders who want to study detailed price action.
What chart is most commonly used for technical analysis?
Candlestick charts are widely used because they display the open, high, low and close while making bullish and bearish price behavior easy to distinguish visually. OHLC charts provide similar underlying information in a different visual format.
Are candlestick charts better than line charts?
Not necessarily. They serve different purposes. Candlestick charts provide more detailed price information, while line charts can make broader trends easier to identify. The better chart depends on what the trader wants to analyze.
Can trading charts predict future prices?
No trading chart can predict future prices with certainty. Technical charts organize historical and current market information so traders can evaluate trends, price behavior and possible scenarios. Trading decisions should always account for uncertainty and risk.